
By J.D. Power, Special for USDR
The full service investment advisory industry is undergoing a historic shift, driven by an actively engaged investor population that is demanding a more hands-on approach from their advisors. According to the J.D. Power 2016 U.S. Full Service Investor Satisfaction Study,SM released today, a steadily increasing number of investment advisory customers have disrupted conventional thinking about full service and self-directed advisory services, favoring a hybrid approach in which advisors become validators, or sounding boards, but not final decision makers.
J.D. Power research has identified three segments of full service investors, which are defined by customer preference for making financial decisions in consultation with a personal financial advisor:
- Validators want to make their own decisions, but still have access to an advisor for support and as a sounding board.
- Collaborators interact with an advisor and depend on that guidance and advice for investment decisions.
- Delegators want an advisor to make decisions on their behalf.
The percentage of full service investment advisory customers who are validators has increased steadily since 2013, and now accounts for 36% of all full service investors. In contrast, the percentage of collaborators has decreased steadily during the same period (to 51% in 2016 from 59% in 2013), while the number of delegators has remained flat. The trend is even more pronounced among Millennials (born 1982-1994), with 64% falling within the validator segment this year.
“The current evolution we’re seeing in investor preferences will likely be accelerated by the further development of new technologies, such as robo-advisors, and by regulatory changes, such as those just issued by the Department of Labor concerning fiduciary standards,” said Mike Foy, director of the wealth management practice at J.D. Power. “Full service firms will need to adapt to these changes by providing more value and transparency to investors, making a clear case for the value they provide vs. lower-cost alternatives.”
Following are additional findings of the 2016 study:
- Investor Satisfaction Remains Flat Despite Challenging Markets: Overall investor satisfaction remains essentially flat year over year (804 in 2016 vs. 807 in 2015 on a 1,000-point scale), despite the worst markets since the 2009 study. More than double the number of investors indicate their own financial situation is better than it was a year ago (29% better vs. 12% worse, respectively). Most (59%) investors indicate their financial situation is about the same.
- Investors Not Getting Goals-Based Advice: Nearly 4 in 10 investors (38%) indicate their advisor did not help them set goals or discuss risk tolerance, and only 42% indicate their advisor met key performance indicators (KPIs) related to setting goals, implementing strategy and ongoing tracking. Performance satisfaction scores are 117 index points higher among investors whose advisor discussed portfolio performance and goal-setting vs. those whose advisor just discussed portfolio performance and asset allocation (783 vs. 666, respectively).
- Confusion over Fees Remains a Challenge: Most investors still do not completely understand their fees (60% in 2016 vs. 56% in 2015), a problem likely to become worse with the proliferation of such low-cost alternatives as robo-advisors and regulatory changes such as the Department of Labor’s recently released rules on implementing a fiduciary standard for all retirement-related accounts.
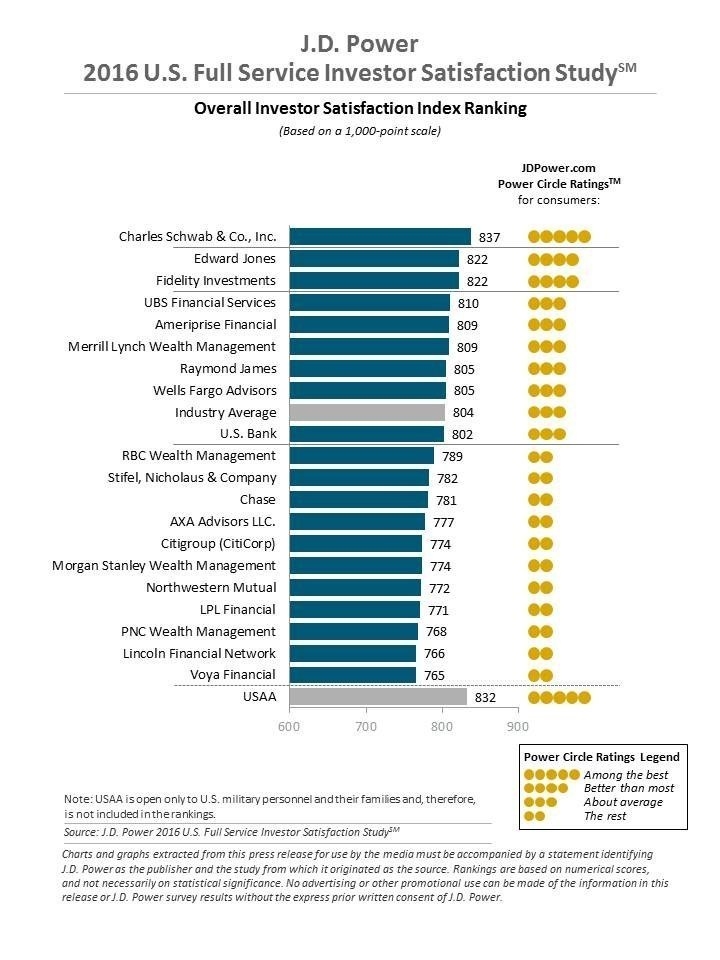
Study Rankings
Charles Schwab & Co., Inc. (837) ranks highest in overall investor satisfaction, followed by Edward Jones and Fidelity Investments (822 each) in a tie, and UBS Financial Services (810).
The study, now in its 14th year, measures overall investor satisfaction with full service investment firms in seven factors (in order of importance): financial advisor (formerly investment advisor); account information; investment performance; product offerings (formerly account offerings); commissions and fees; website; and problem resolution.
The 2016 U.S. Full Service Investor Satisfaction Study was fielded in January 2016 and is based on responses from more than 6,000 investors who make some or all of their investment decisions with a financial advisor.
For more information about the J.D. Power U.S. Full Service Investor Satisfaction Study, visit http://www.jdpower.com/resource/us-full-service-investor-satisfaction-study
See the online Press Release at http://www.jdpower.com/press-releases/2016-us-full-service-investor-satisfaction-study
About J.D. Power and Advertising/Promotional Rules www.jdpower.com/about-us/press-release-info http://www.jdpower.com/about/index.htm
SOURCE J.D. Power