By National Association of Realtors, Special for USDR
Can a groundhog and his shadow predict the strength of the housing market? Here is what happened the past 20 years in real estate when Punxsutawney Phil climbed out of his hole; does seeing his shadow extend to real estate? You decide.

|
Shadow of a Doubt: Groundhog Day and Real Estate |
|||||||
|
Year |
Shadow |
Home Sales Increase |
Home Price Increase |
Year |
Shadow |
Home Sales |
Home Prices |
|
1996 |
Yes |
8.3 |
4.6 |
2007 |
No |
-22.3 |
-1.3 |
|
1997 |
No |
5.0 |
5.2 |
2008 |
Yes |
-18.3 |
-9.5 |
|
1998 |
Yes |
13.5 |
5.3 |
2009 |
Yes |
5.6 |
-12.9 |
|
1999 |
No |
4.3 |
3.9 |
2010 |
Yes |
-3.5 |
0.2 |
|
2000 |
Yes |
-0.1 |
4.1 |
2011 |
No |
1.7 |
-3.9 |
|
2001 |
Yes |
3.1 |
6.6 |
2012 |
Yes |
9.4 |
6.4 |
|
2002 |
Yes |
5.6 |
7.7 |
2013 |
No |
9.2 |
11.5 |
|
2003 |
Yes |
9.6 |
8.4 |
2014 |
Yes |
-2.9 |
5.7 |
|
2004 |
Yes |
9.7 |
9.3 |
2015 |
Yes |
6.3 |
6.8 |
|
2005 |
Yes |
4.5 |
12.4 |
2016 |
No |
3.8 |
5.2 |
|
2006 |
Yes |
-8.5 |
1.0 |
Sees no shadow |
0.3 |
3.4 |
|
|
Sees a shadow |
2.8 |
3.7 |
|||||
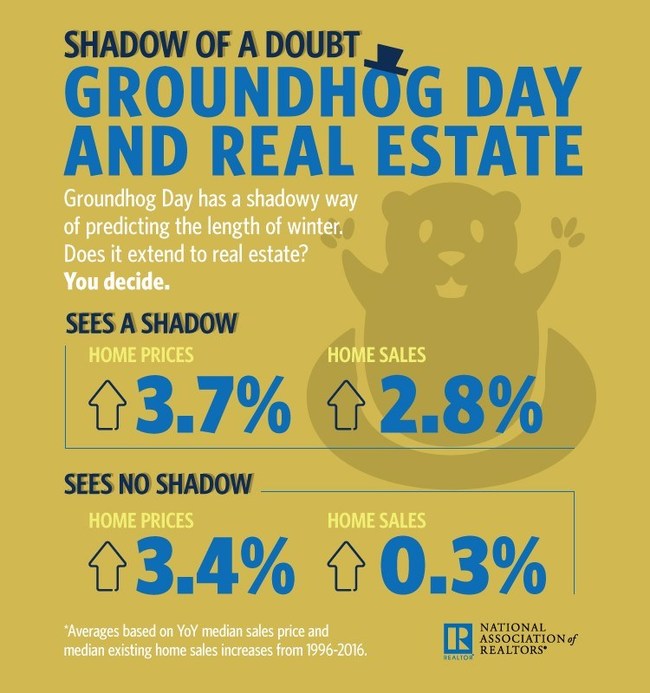
*Averages based on YoY median sales price and median existing home sales increases from 1996-2016.
The National Association of Realtors®, “The Voice for Real Estate,” is America’s largest trade association, representing more than 1.1 million members involved in all aspects of the residential and commercial real estate industries.
Information about NAR is available at www.realtor.org. This and other news releases are posted in the “News, Blogs and Videos” tab on the website.
SOURCE National Association of Realtors